Living Canvas: Miro Data Visualisation
Turning Miro's live product activity into an evolving artwork.
- What
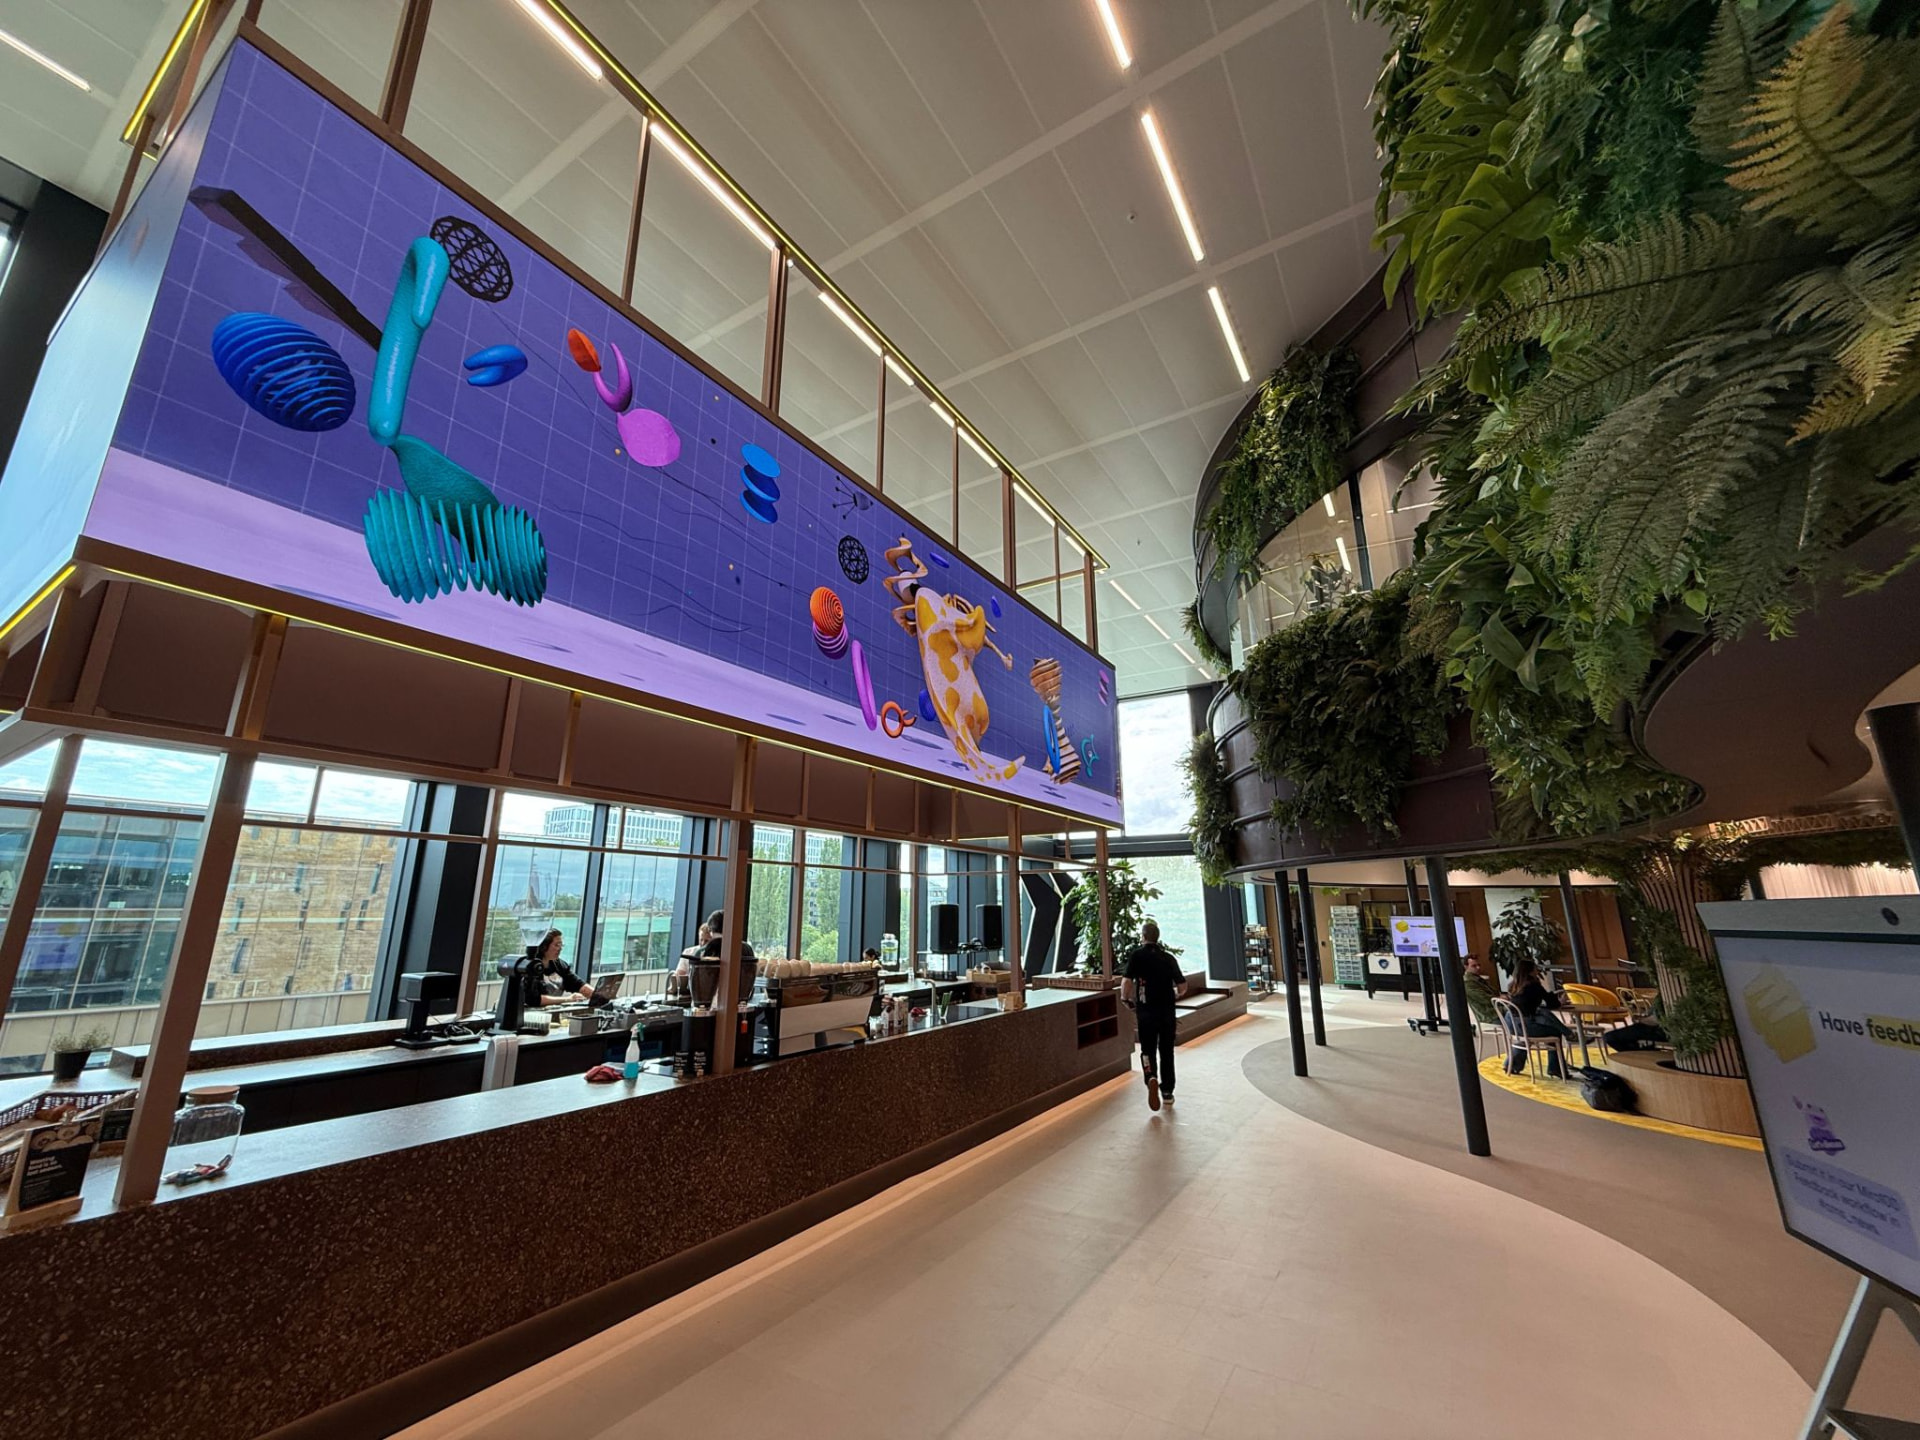
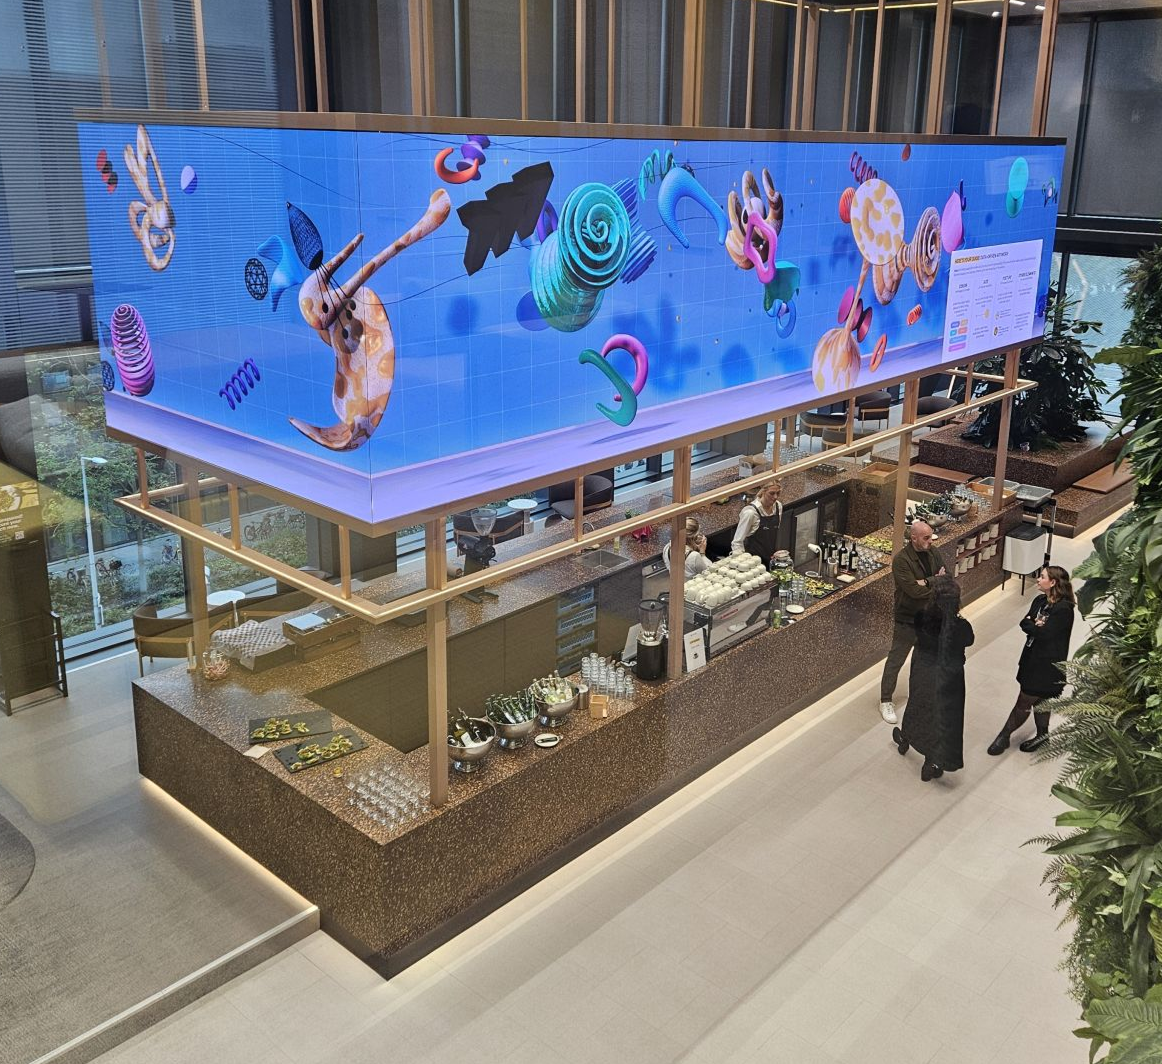
- A generative artwork for Miro's Amsterdam HQ that turns live activity across Miro into an evolving composition on an architectural screen.
- My role
- Concept development, creative direction and visual design, translating product data into a visual system.
- Collaborators
- Miro's creative and technical teams
- Delivered
- A data-driven visual system, the Miró-inspired 3D visual language and the installation running at Miro100.
The brief
What if you could see collaboration happening?
Zoom out on a busy Miro board and individual contributions form a bigger picture. The new HQ needed a piece that made that invisible activity visible in the room.

My approach
Use data as material, not charts. From Miró to Miro.
Instead of numbers, activity across Miro drives shapes, colour and movement. The forms take Joan Miró's abstract language into three dimensions, mixed with the organic textures and 3D-printed details already in Miro100.
How it works
A system, not a loop.
- Miro activity
- data
- visual behaviours
- evolving composition
New activity adds forms that appear, build up and interact, so the artwork changes with the rhythm of Miro's community. No two days look the same.
The result
Installed at Miro100, Amsterdam.